Nuestros mejores spreads y condiciones
 Acerca de la plataforma

The USD/CHF dives after reaching a weekly high on Thursday, around 0.9900, and plunges towards the 0.9770s region on upbeat US data, which pared expectations of a Federal Reserve larger-than-expected rate hike, which was cheered by investors, as reflected by global equities rising.
The USD/CHF is trading at 0.9775, near the daily lows, after hitting a 0.9840 daily high, just above the daily pivot, which once broken, paved the way for a free fall below 0.9800, and further extending towards the S1 pivot area around 0.9773.
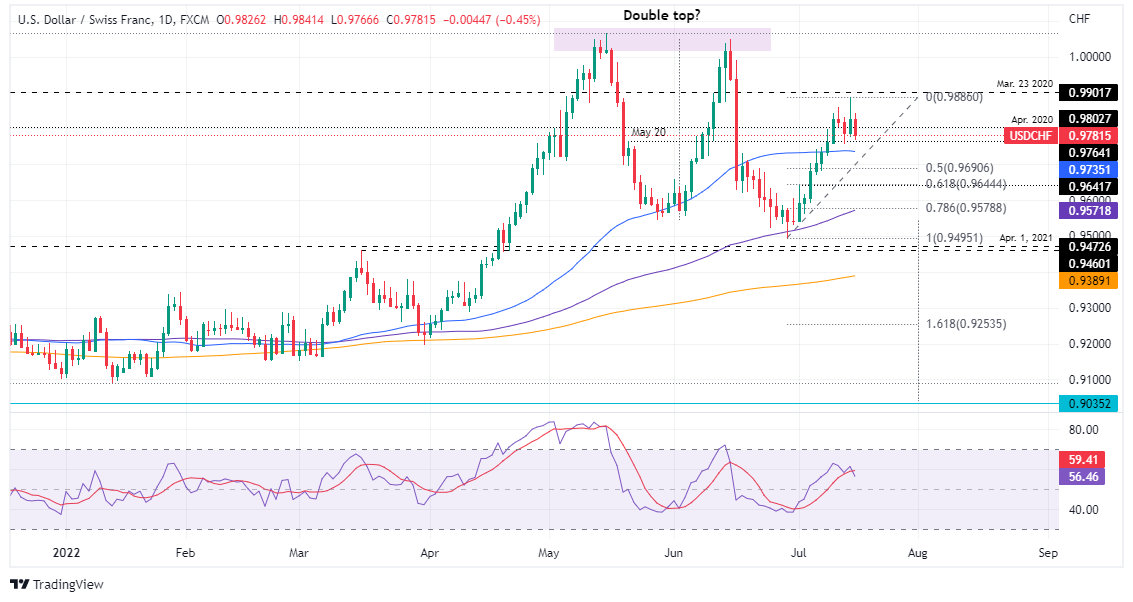
The USD/CHF daily chart shows that it is still favoring longs. The ongoing pullback from weekly highs near 0.9900 could be capped around the 50-day moving average (DMA) at 0.9735, though the Relative Strength Index (RSI) at 56.03 keeps pushing lower, which means that sellers might be eyeing the 50% Fibonacci retracement at around 0.9690, looking forward for an RSI’s uptick, that could give buyers a go, to re-enter USD/CHF longs.
If that scenario plays out, USD/CHF’s first resistance would be 0.9700, followed by 0.9735 and 0.9800. Otherwise, the USD/CHF pullback could continue its fall towards the 61.8% Fibonacci level at 0.9644, followed by the figure at 0.9600.