Nuestros mejores spreads y condiciones
 Acerca de la plataforma

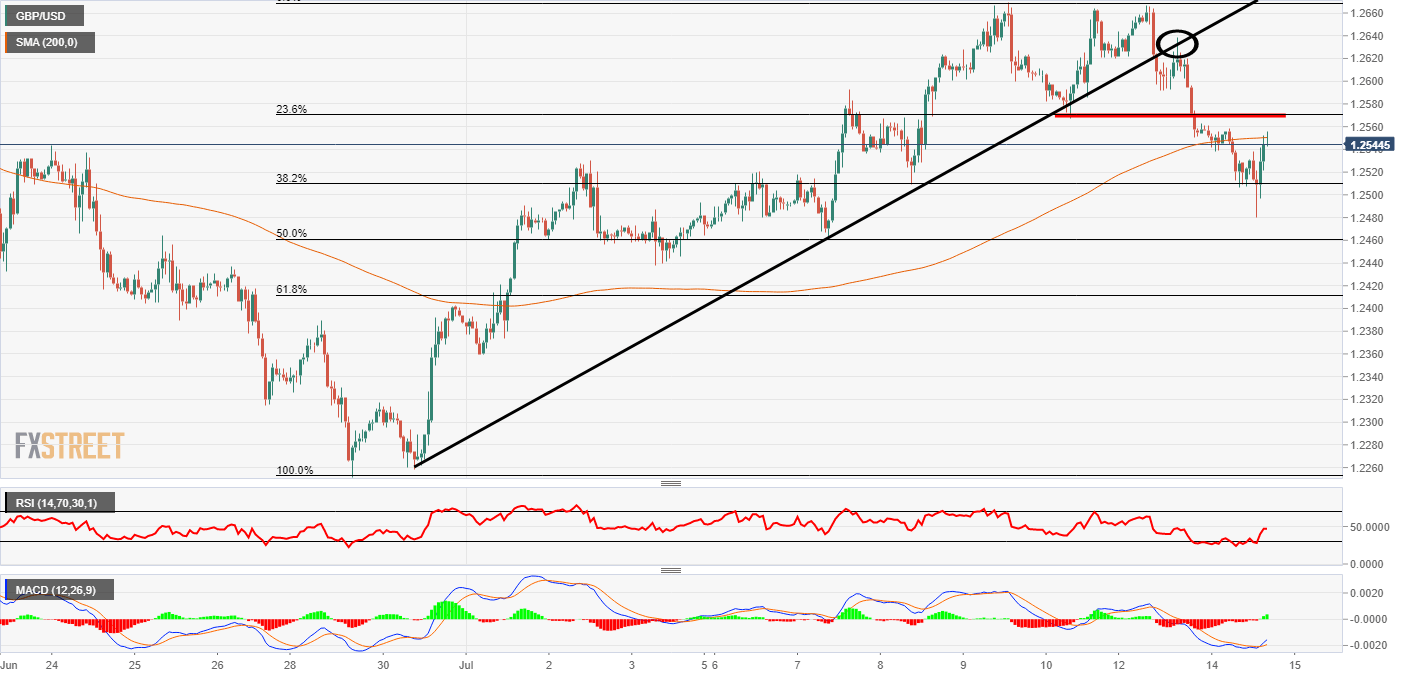
GBP/USD started Tuesday as one of the worst performers but recently there has been a pick up in the price. From the hourly chart below its clear that over the last five candles the bulls have managed to defend the 1.25 area. The area is a pretty decent support area as it has the 38.2% Fibonacci level and a previous consolidation high.
This may not mean the downtrend is over just yet as the 1.2571 area looks like a strong resistance. The aforementioned level was the wave low after the price hit the high on the chart and bounced back down. It has not been tested since the pair broke through yesterday (Monday) during the US session. Interestingly the trendline break looks firm as after the break there was a textbook retest and move lower.
Looking at the indicators, the 200 Simple Moving Average is also nearby and could be a potential resistance area. The Relative Strength Index has moved away from the oversold point and there could now be some more room for bearishness. The MACD histogram is now green but watch out for another move lower back into the red meeting up with the signal lines.