Confirming you are not from the U.S. or the Philippines

Por medio de esta declaración, confirmo y doy fe que:
  • No soy ciudadano(a) o residente americano(a)
  • No resido en Filipinas
  • No poseo directa o indirectamente más del 10% de acciones/derechos de voto/intereses de residentes americanos y/o ningún ciudadano, ciudadana o residente americano está bajo mi control bajo ningún medio.
  • No poseo directa o indirectamente más del 10% de acciones/derechos de voto/intereses de residentes americanos y/o ningún ciudadano, ciudadana o residente americano está bajo mi control bajo ningún medio.
  • No estoy afiliado(a) a ciudadanos o residentes americanos bajo los términos de la Sección 1504 (a) del FATCA
  • Estoy consciente de mis responsabilidades por realizar o haber realizado una declaración falsa.
A los efectos de esta declaración, todos los países y territorios dependientes de EE. UU. están bajo las mismas condiciones y efectos del territorio principal de EE. UU. Me comprometo a defender y exonerar de toda responsabilidad a Octa Markets Incorporated, a sus directores y funcionarios contra cualquier reclamo que surja o esté relacionado con cualquier incumplimiento de mi declaración en este documento.
Estamos dedicados a tu privacidad y la seguridad de tu información personal. Solo recopilamos correos electrónicos para brindar ofertas especiales e información importante sobre nuestros productos y servicios. Al enviar tu dirección de correo electrónico, aceptas recibir dichos correos de nuestra parte. Si quieres darte de baja o tienes alguna duda o consulta, contacta nuestro Servicio de Asistencia al Cliente.
Octa trading broker
Abrir una cuenta
Back

GBP/USD daily chart shows we are at a key technical resistance zone of 1.2750

  • More USD selling pushes cable to trade 0.14% higher after being in the red for most of the session.
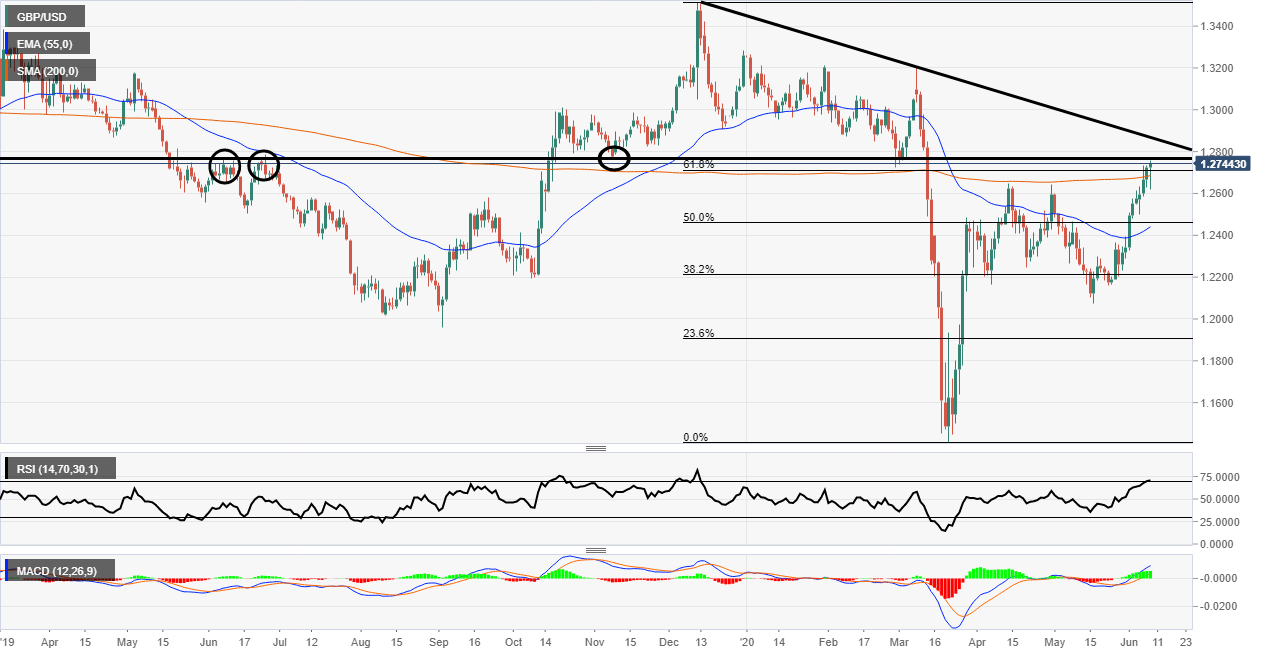
  • The price is now firmly above the 200 Simple Moving Average. 

GBP/USD daily chart

GBP/USD looked at one point like it would topple over but the USD sellers came back in full force and the pair moved higher. This means the price is now firmly above the 200 period Simple Moving Average (SMA). 

This now brings the price right up to the resistance line where the price has reacted a few times on the chart already (circles). Alongside this, the market is also at the 61.8% Fibonacci retracement zone. 

Conversely, the Relative Strength Index is looking very overbought. This indicates there could be some kind of pullback as the market is overextended to the upside. The MACD is looking very bullish as the signal lines are above the mid-point and the histogram is green. 

Lastly, there is a black trendline above the current price level and if the market keeps moving higher the level could provide some resistance. It must be noted that the trend is still up but the Fed meeting is an important event and traders are waiting for more clarity from the central bank.

Cable daily chart

Additional levels


EUR/USD steadies around 1.1350, looks to post highest daily close in three months

The EUR/USD pair spent the first half of the day below 1.1300 but started to edge higher during the American trading hours. After advancing to a daily
Leer más Previous

US CPI Preview: Don't expect the market to react too much – TD Securities

On Wednesday, the Federal Reserve will announce its decision on monetary policy. Previously, at 12:30 GMT, US inflation data from May is due. Accordin
Leer más Next