Back
26 Feb 2020
US Dollar Index Asia Price Forecast: DXY bearish correction from 2020 top intact
- DXY is in retracement mode for the fourth consecutive day.
- The level to beat for sellers is the 99.00 figure.
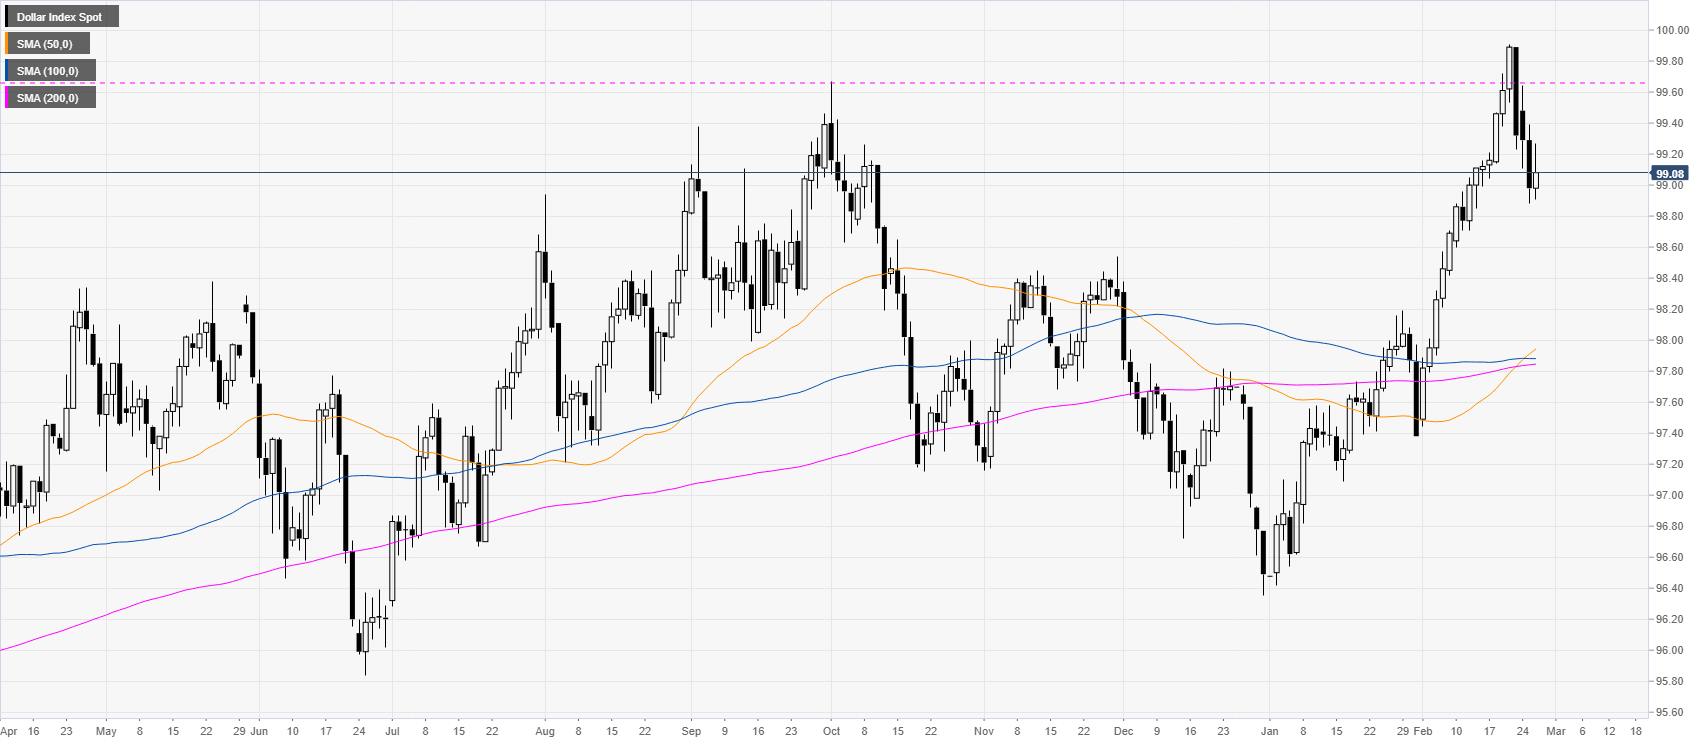
DXY daily chart
The US dollar index (DXY) is pulling back down below the 2019 high at 99.67 level. The risk-off mode and the all-time low in US bond-yields are weighing on DXY.
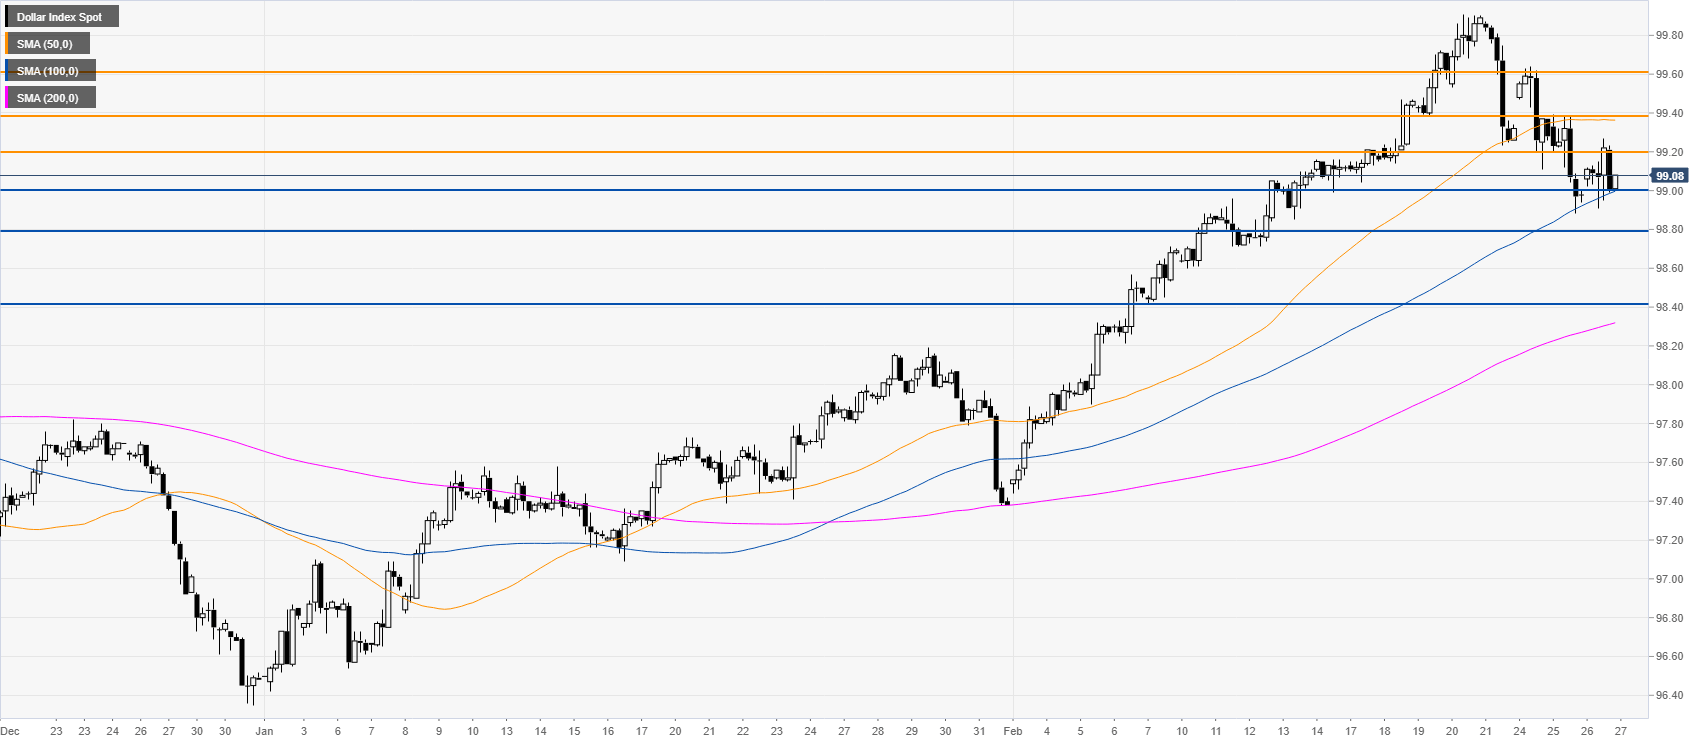
DXY four-hour chart
The greenback is trading near its lowest in seven days while challenging the 100 SMA on the four-hour chart. The current weakness is probably going to lead to further losses, especially on a break below the 99.00 figure en route towards the 98.80 and 98.40 price levels. DXY is expected to meet resistance on any run to 99.20 or 99.40 level.
Additional key levels