EUR/USD remains capped and vulnerable to additional falls – Confluence Detector
EUR/USD has hit new 2020 lows late last week and is hovering near the lows. Where next for the world's most popular currency pair?
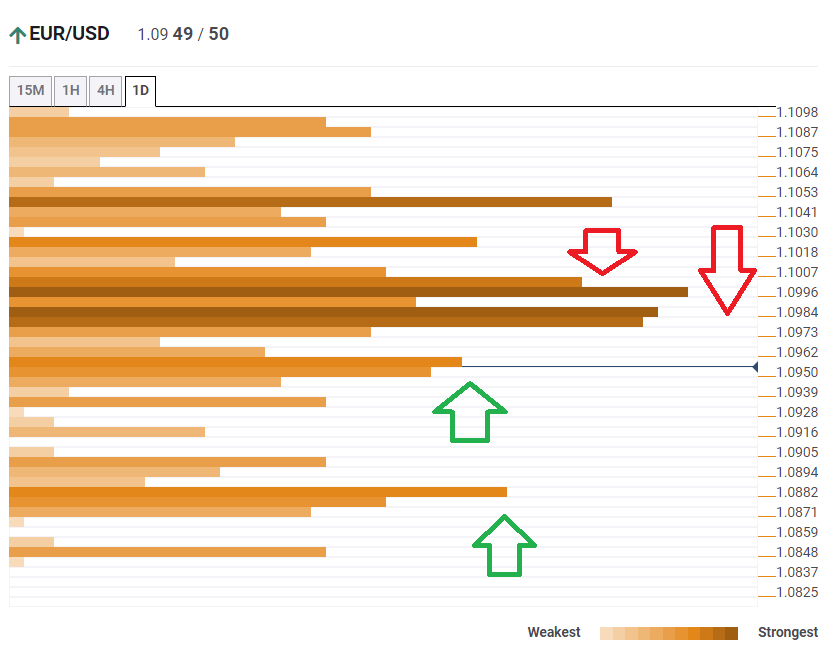
The Technical Confluences Indicator is showing that EUR/USD is struggling around 1.0955, which is the convergence of the Simple Moving Average 10-1h, the Fibonacci 23.6% one-day, the Bollinger Band one-hour Middle, the BB 15min-Middle, the SMA 5-15m, the SMA 10-15m, and more.
Further above, it is capped by a dense cluster of lines around 1.0984, which includes the Pivot Point one-month Support 1, the BB 4h-Middle, the PP one-day R1, and the Fibonacci 23.6% one-week.
Close by at 1.1001, the confluence of the previous monthly low, the Fibonacci 38.2% one-week, and the previous daily high serves as another resistance line.
Looking down, support awaits at 1.0882, which is where last year's low point meets the Pivot Point one-day Support 3.
Here is how it looks on the tool:
Confluence Detector
The Confluence Detector finds exciting opportunities using Technical Confluences. The TC is a tool to locate and point out those price levels where there is a congestion of indicators, moving averages, Fibonacci levels, Pivot Points, etc. Knowing where these congestion points are located is very useful for the trader, and can be used as a basis for different strategies.
This tool assigns a certain amount of “weight” to each indicator, and this “weight” can influence adjacents price levels. These weightings mean that one price level without any indicator or moving average but under the influence of two “strongly weighted” levels accumulate more resistance than their neighbors. In these cases, the tool signals resistance in apparently empty areas.
Learn more about Technical Confluence