GBP/JPY Price Analysis: Pulls back from monthly resistance trendline
- GBP/JPY drops from a five-week high, upper-line of the monthly triangle.
- 200-bar SMA joins the formation support to restrict near-term declines.
- December 13 lows can please buyers during the upside break.
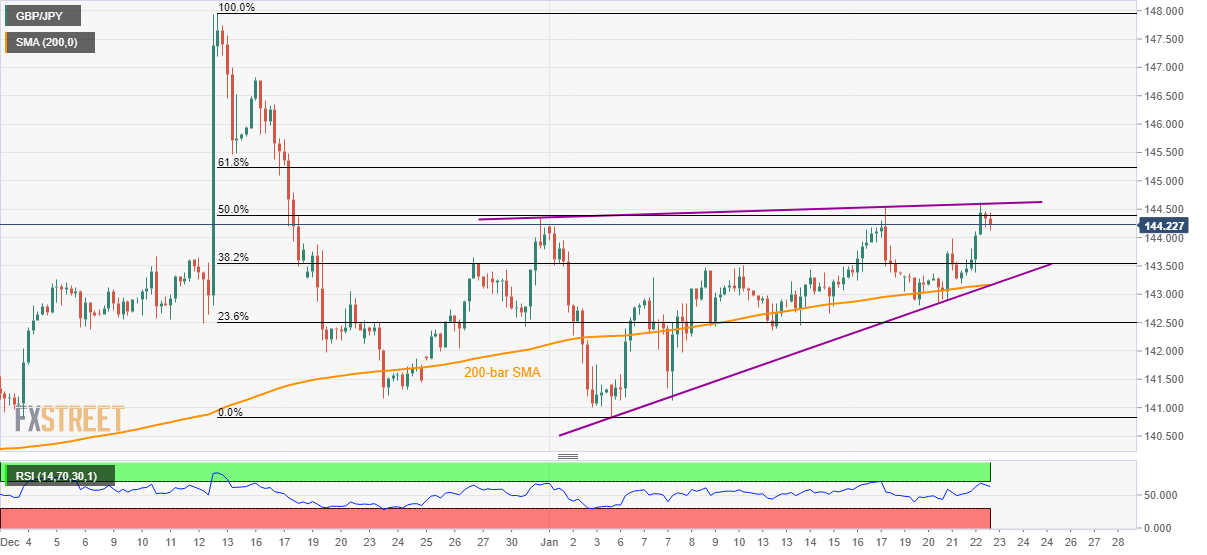
GBP/JPY declines to 144.14 during the early Asian session on Thursday. In doing so, the pair steps back from an upward sloping trend line from December 31 amid overbought RSI conditions.
As a result, traders will look for further fall to 38.2% Fibonacci retracement of the pair’s declines from December 13 to January 05, at 143.55.
However, 143.17/15 area including 200-bar SMA and a support line of the formation will be the tough nut to crack for the bears during additional downside.
Alternatively, pair’s rise past-144.60 defies the triangle and will enable buyers to aim for the December 13 low near 145.50.
If the bulls manage to dominate beyond 145.50, December 16 top close to 146.80 and the previous month's peak near 148.00 will be in focus.
GBP/JPY four hour chart
Trend: Pullback expected