Confirming you are not from the U.S. or the Philippines

Por medio de esta declaración, confirmo y doy fe que:
  • No soy ciudadano(a) o residente americano(a)
  • No resido en Filipinas
  • No poseo directa o indirectamente más del 10% de acciones/derechos de voto/intereses de residentes americanos y/o ningún ciudadano, ciudadana o residente americano está bajo mi control bajo ningún medio.
  • No poseo directa o indirectamente más del 10% de acciones/derechos de voto/intereses de residentes americanos y/o ningún ciudadano, ciudadana o residente americano está bajo mi control bajo ningún medio.
  • No estoy afiliado(a) a ciudadanos o residentes americanos bajo los términos de la Sección 1504 (a) del FATCA
  • Estoy consciente de mis responsabilidades por realizar o haber realizado una declaración falsa.
A los efectos de esta declaración, todos los países y territorios dependientes de EE. UU. están bajo las mismas condiciones y efectos del territorio principal de EE. UU. Me comprometo a defender y exonerar de toda responsabilidad a Octa Markets Incorporated, a sus directores y funcionarios contra cualquier reclamo que surja o esté relacionado con cualquier incumplimiento de mi declaración en este documento.
Estamos dedicados a tu privacidad y la seguridad de tu información personal. Solo recopilamos correos electrónicos para brindar ofertas especiales e información importante sobre nuestros productos y servicios. Al enviar tu dirección de correo electrónico, aceptas recibir dichos correos de nuestra parte. Si quieres darte de baja o tienes alguna duda o consulta, contacta nuestro Servicio de Asistencia al Cliente.
Octa trading broker
Abrir una cuenta
Back

USD/JPY Technical Analysis: Weekly close beyond 109.70/75 will be a call to bulls

  • USD/JPY trades positive near the two-week high, on a five-day winning streak.
  • Bullish engulfing on the weekly chart confronts 109.48/52 resistance confluence.
  • 200-week SMA adds to the resistance.

USD/JPY takes the bids to 109.55 during the initial trading session on Friday. In doing so, the pair registers a bullish candlestick formation on the weekly chart that currently confronts the key resistance confluence.

In addition to 109.48/52 area including 50% Fibonacci retracement of October 2018 top to August 2019 low and a downward sloping trend line since November 2018, 200-week SMA around 109.70/75 also challenges the buyers.

If at all USD/JPY prices register a weekly closing beyond 109.75, it confirms the bullish engulfing candlestick pattern on the chart while also the bulls to aim for the late-May top near 110.00.

Following that, 61.8% Fibonacci retracement level of 110.70 and April 2019 high of 112.40 will lure the buyers.

On the downside, pair’s declines below 108.45/40 hold the key to 108.00 and 107.50 support levels. However, the pair’s drop beneath 107.50 might not refrain from dragging the quote to the sub-107.00 region.
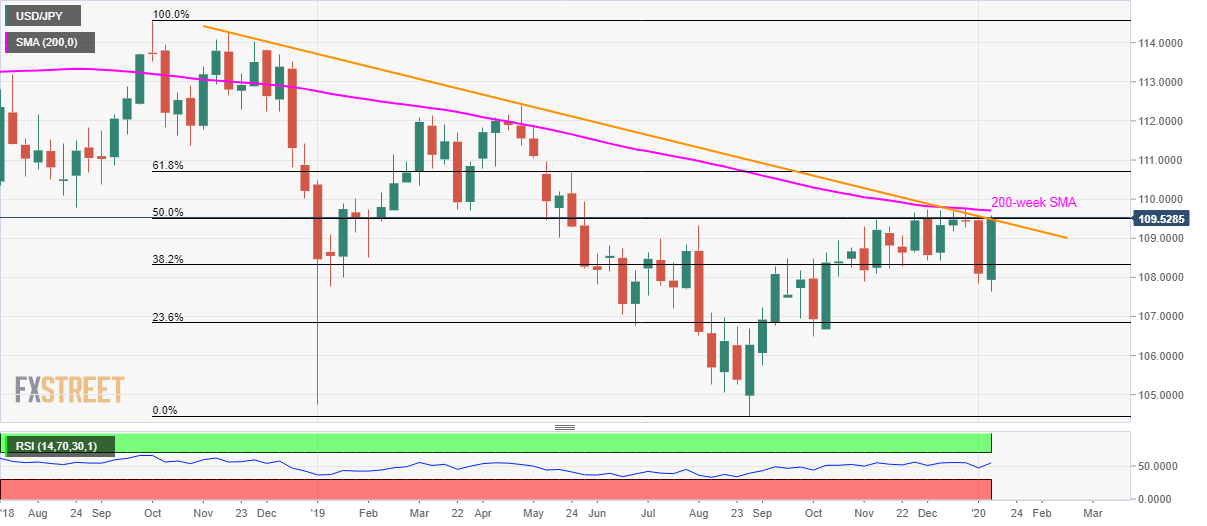
USD/JPY weekly chart

Trend: Bullish


BI Survey: Indonesia's Retail Sales rise 1.3% YoY in Nov, Rupiah at 21-month highs

Indonesia's Retail Sales grew by 1.3% on the year in November vs. a 3.6% jump seen in October, the latest survey conducted by Bank Indonesia (BI), the
Leer más Previous

India: Increase in headline inflation to bring an end to easing cycle – Capital Economics

In their latest client note, analysts at Capital Economics note that India’s headline retail inflation likely accelerated to a five-year high in Decem
Leer más Next