Confirming you are not from the U.S. or the Philippines

Por medio de esta declaración, confirmo y doy fe que:
  • No soy ciudadano(a) o residente americano(a)
  • No resido en Filipinas
  • No poseo directa o indirectamente más del 10% de acciones/derechos de voto/intereses de residentes americanos y/o ningún ciudadano, ciudadana o residente americano está bajo mi control bajo ningún medio.
  • No poseo directa o indirectamente más del 10% de acciones/derechos de voto/intereses de residentes americanos y/o ningún ciudadano, ciudadana o residente americano está bajo mi control bajo ningún medio.
  • No estoy afiliado(a) a ciudadanos o residentes americanos bajo los términos de la Sección 1504 (a) del FATCA
  • Estoy consciente de mis responsabilidades por realizar o haber realizado una declaración falsa.
A los efectos de esta declaración, todos los países y territorios dependientes de EE. UU. están bajo las mismas condiciones y efectos del territorio principal de EE. UU. Me comprometo a defender y exonerar de toda responsabilidad a Octa Markets Incorporated, a sus directores y funcionarios contra cualquier reclamo que surja o esté relacionado con cualquier incumplimiento de mi declaración en este documento.
Estamos dedicados a tu privacidad y la seguridad de tu información personal. Solo recopilamos correos electrónicos para brindar ofertas especiales e información importante sobre nuestros productos y servicios. Al enviar tu dirección de correo electrónico, aceptas recibir dichos correos de nuestra parte. Si quieres darte de baja o tienes alguna duda o consulta, contacta nuestro Servicio de Asistencia al Cliente.
Octa trading broker
Abrir una cuenta
Back

S&P500 Technical Analysis: Bears challenge the 2,700.00 figure

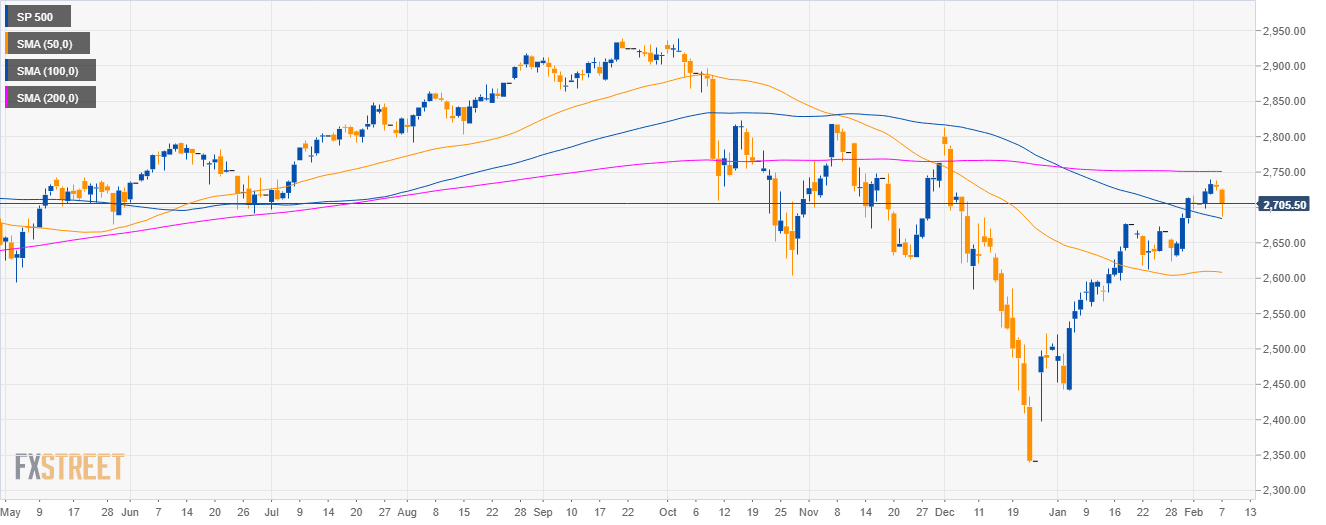
S&P500 daily chart

  • The S&P500 Index is having a strong bullish reversal after a deep pullback below the 200-day simple moving average (DSMA).
  • Bears challenged the 100 DSMA.

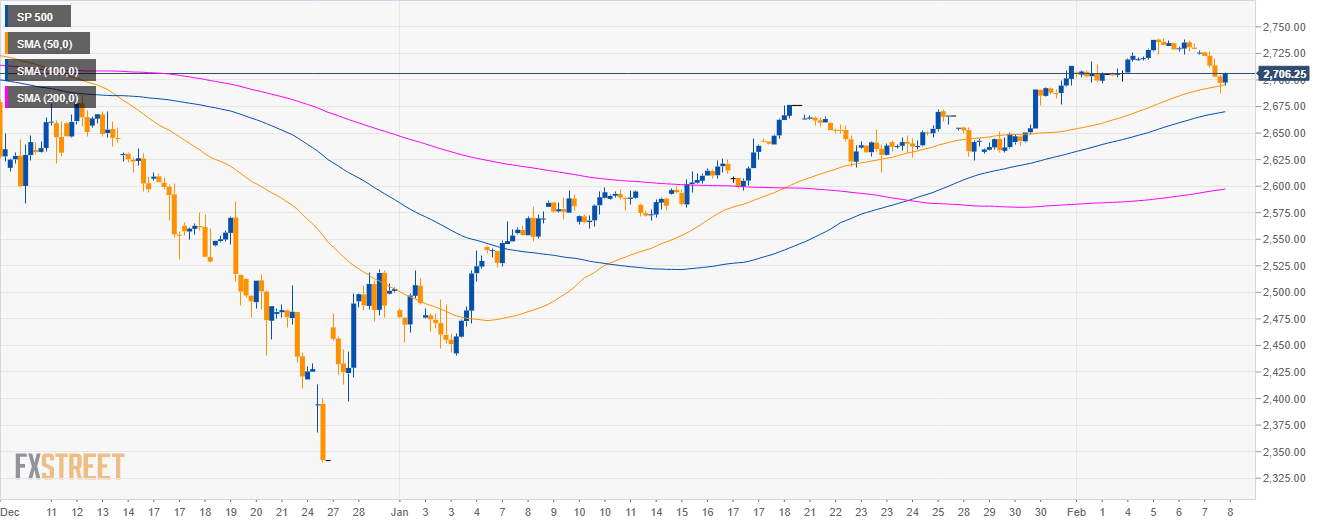
S&P500 4-hour chart

  • The market found some support near the 2,700 figure and the 50 SMA. 
S&P500 30-minute chart

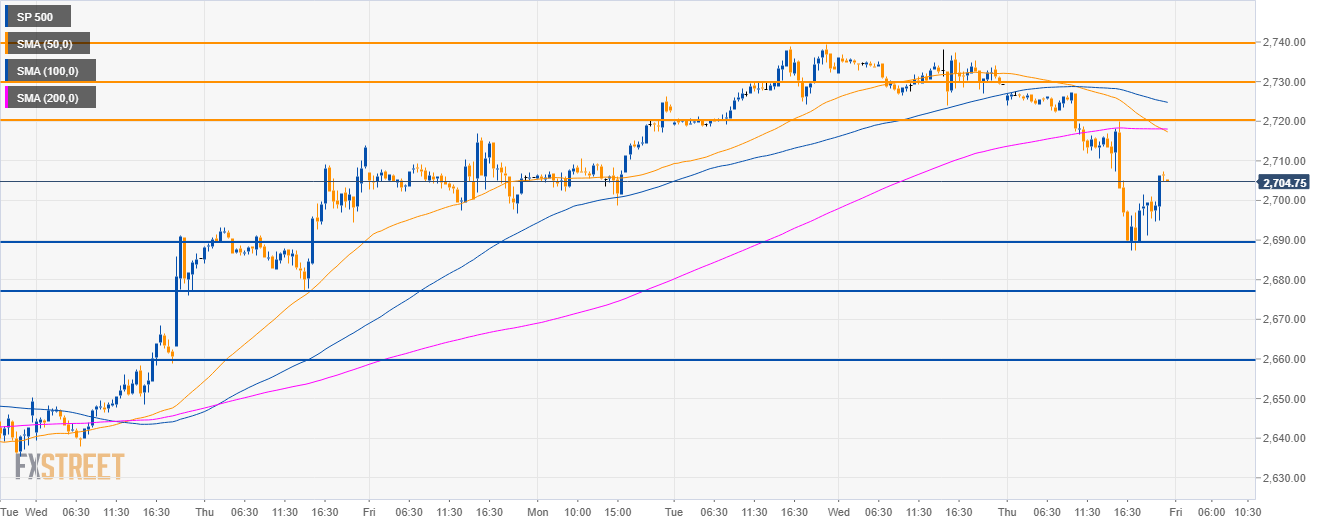
  • The S&P500 is trading below the main SMAs suggesting bearish momentum.
  • However, as the market found support at 2,690.00 level, bulls can drive the market to 2,720.00 and 2,730.00 in the short-term.
  • To the downside, support is seen at 2,690.00, 2,680.00 and 2,660.00 levels.

Additional key levels

SP 500

Overview:
    Today Last Price: 2706.25
    Today Daily change: -23.00 points
    Today Daily change %: -0.84%
    Today Daily Open: 2729.25
Trends:
    Daily SMA20: 2670.18
    Daily SMA50: 2609.37
    Daily SMA100: 2686.33
    Daily SMA200: 2750.95
Levels:
    Previous Daily High: 2738
    Previous Daily Low: 2724
    Previous Weekly High: 2717
    Previous Weekly Low: 2623.75
    Previous Monthly High: 2714
    Previous Monthly Low: 2441
    Daily Fibonacci 38.2%: 2729.35
    Daily Fibonacci 61.8%: 2732.65
    Daily Pivot Point S1: 2722.83
    Daily Pivot Point S2: 2716.42
    Daily Pivot Point S3: 2708.83
    Daily Pivot Point R1: 2736.83
    Daily Pivot Point R2: 2744.42
    Daily Pivot Point R3: 2750.83


USD/JPY remains directionless in weekly range below 110

With the dismal market mood helping the JPY stay resilient against the greenback, the USD/JPY continued to move up and down in its weekly range below
Leer más Previous

NZD/USD steadies near 0.6750, looks to close in red for second straight day

After losing more than 100 pips following the disappointing labour market data from New Zealand, which showed that the unemployment rate rose to 4.3%
Leer más Next