

Gold Price Forecast: XAU/USD bearish head and shoulders in play, eyes on $1,850
- Gold Price is steady ahead of crucial United States of America Consumer Price Index (CPI) inflation data due Thursday.
- US Dollar pressured vs. risk markets that performed well ahead of the December CPI report.
- Gold price has dropped below key structure following the test of equal highs and is now printing prospects of a bearish head and shoulders.
Gold price was capped at the highest in more than eight months on Wednesday, while investors anticipate the United States of America Consumer Price Index (CPI) inflation data due Thursday. At the time of writing, Gold price is flat on the day at $1,876 but it had travelled between a low of $1,867.22 and reached a high of $1,886.69.
US Consumer Price Index is key for Gold price
The moves come ahead of the December inflation report, which is expected to show US prices rose by an annualized 6.5%. This is lower than November's 7.1% pace. Investors are monitoring the Consumer Price Index closely as the expectations are that if it were to continue to decelerate, so too will the Federal Reserve's pace of rate hikes.
In this regard, analysts at TD Securities explained that they are looking for the core Consumer Price Index to have edged higher on a monthly basis in December, ''closing out the year on a relatively stronger footing,'' they said.
''Indeed, we forecast a firm 0.3% MoM increase, as services inflation likely gained momentum. In terms of the headline, we expect the Consumer Price Index inflation to register a slight decline on an unrounded basis in December, but rounded up to flat MoM, as energy prices offered large relief again. Our MoM projections imply that headline and core CPI inflation likely lost speed on a YoY basis in December.''
US Dollar could depend on US CPI
As for the US Dollar, the analysts said, ''unless the core measure significantly surprises to the upside, US Dollar rallies should be sold into. We think the bar is high to compel a reversal of fortune despite the US Dollar tactically stretched.''
Meanwhile, the DXY index, which measures the US Dollar vs. a basket of currencies, is trading flat near 103.24 after meeting a new cycle low Monday near 102.944. The next target to the downside is the May low near 101.297. However, the US Dollar is poised for a bullish continuation technically speaking where an M-formation is in play:
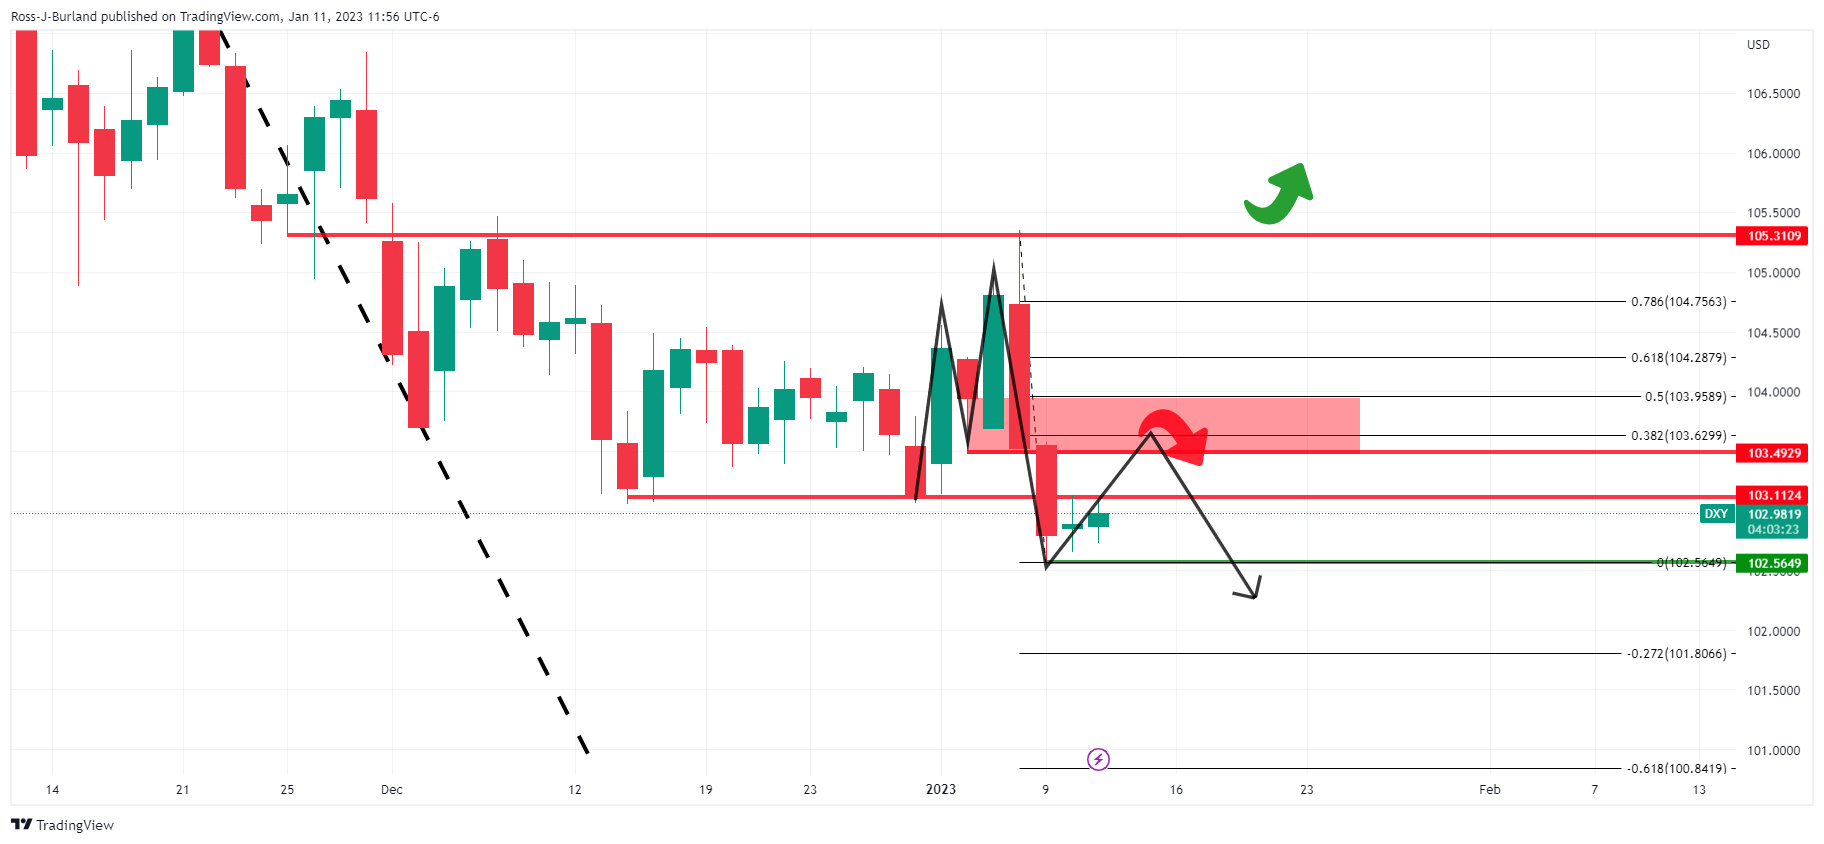
The M-formation on the US dollar chart is a reversion pattern and the price would be expected to move in for the restest of the resistance structures and neckline of the pattern between 103.50 and 104.00. Such a move in the US Dollar would align with a 38.2% Fibonacci retracement and a 50% mean reversion at the extreme, a major weight for Gold price.
China has been on the bid, supporting Gold price higher
Analysts at TD Securities argued that ''the strength in Gold price is inconsistent with the bearish macro backdrop, as highlighted by its diverging relationship with real rates.''
The analysts explained that ''under the hood, relentless buying from China has fueled a squeeze on CTA trend follower positioning over the past months, and has yet to show signs of abating.'' The analysts said ''mysterious large-scale Chinese purchases of gold have single-handedly catalyzed a $150/oz rally.''
''Our tracking of positioning for the top ten traders in China highlights a continued accumulation of gold, with this cohort adding another 2.4 tonnes of notional gold to their net length overnight,'' the analysts at TD Securities added.
''CTA trend followers could still exacerbate upside flows with a break north of the $1,900/oz mark likely to spark a sizeable buying program equivalent to nearly +8% of algos' maximum historical position size,'' the analysts explained.
Gold price technical analysis
However, Gold price has started to show signs that its four-day bullish impulse is starting to decelerate given Wednesday's doji:

The following technical analysis of the Gold price arrives at a bearish conclusion, at least for the near term:
In the prior day's analysis, it was explained that on the daily Gold price chart, we could see prior equal highs finally being tested and ''swept'' as follows:
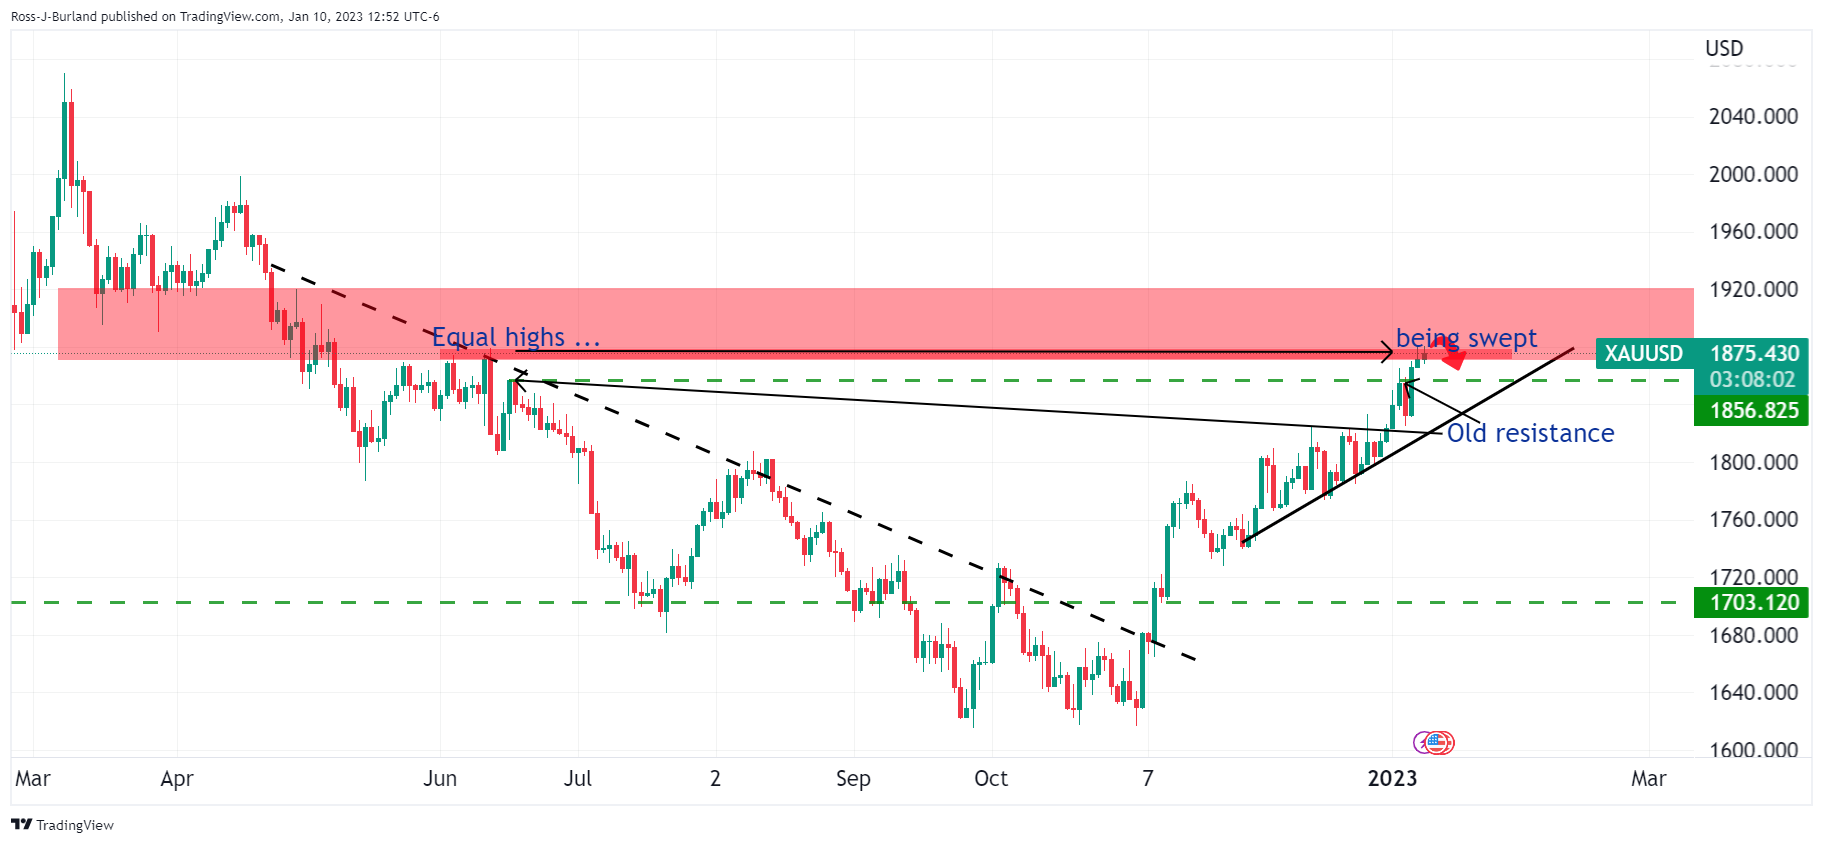
The phenomenon occurs on a fractal basis whereby the equal levels are ''swept'' only to fuel a reversal in the Gold price. We are still in this process and the Gold price moved in on liquidity in the $1,886s on Wednesday. This was an area of expected resistance highlighted the prior day on the 4-hour chart:

Gold price, H4 chart update
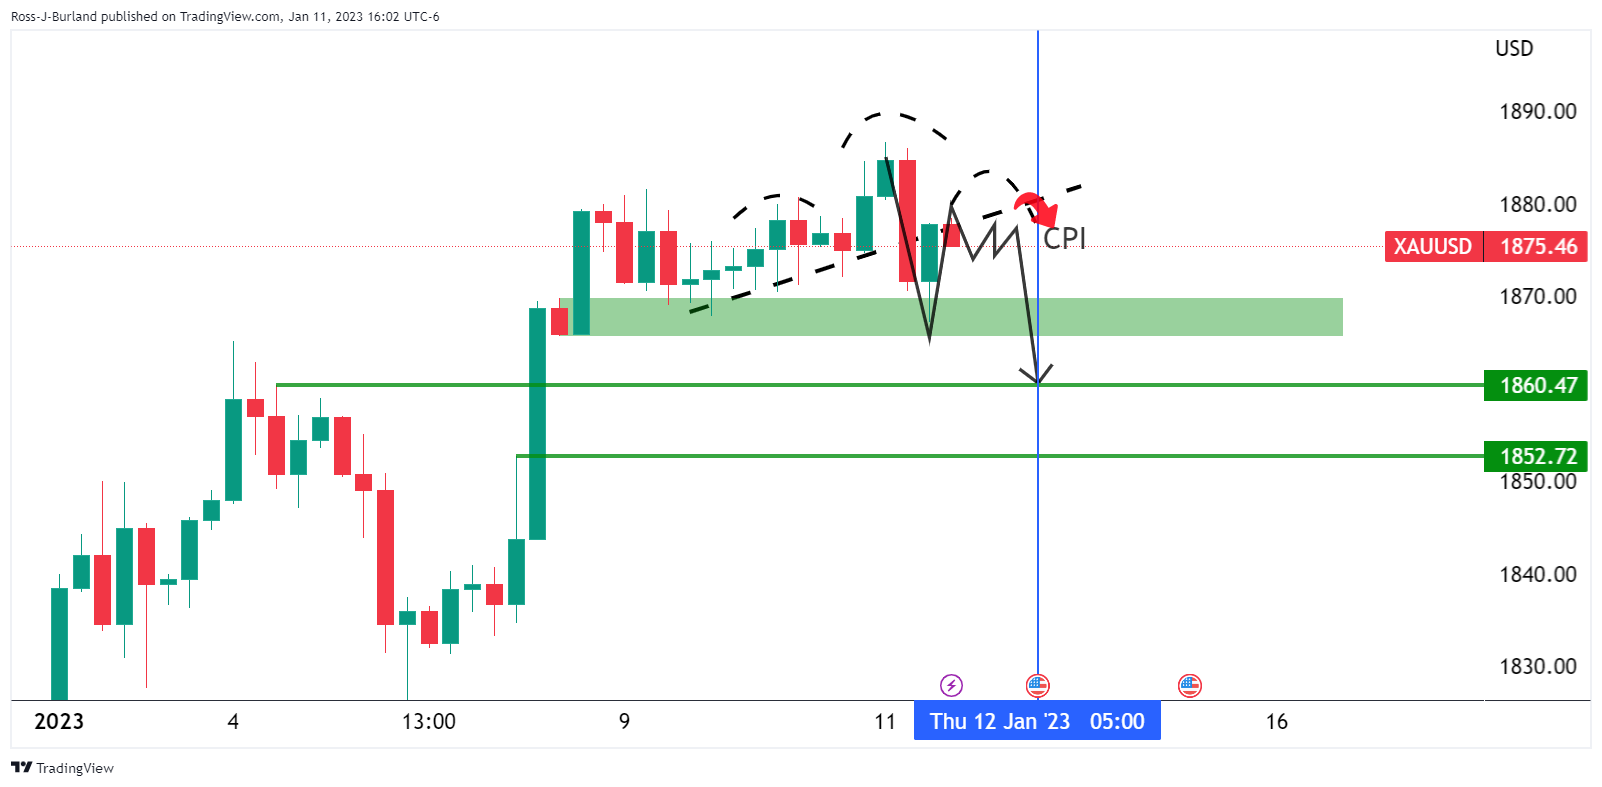
As per the prior analysis, the Gold price has indeed dropped below the structure following the test of the equal highs. The Gold price is now printing prospects of a bearish head and shoulders pattern as potential peak formation into the US consumer Price Index. Gold price bears will need to break the $1,870 structure that ultimately guards the target area some $20/oz below to test the $1,850s.